
Disposal Facility-Based Waste Characterization Study
California Threw About 40 Million Tons of Trash in Landfills in 2021
To help California plan how to cut waste and pollution, CalRecycle oversees a study of what gets dumped into landfills, called California’s 2021 Disposal Facility-Based Waste Characterization.
California sent about the same amount of trash to landfills in 2018 as 2021, but sent 6% less organic waste with the statewide launch of food and yard waste recycling to cut landfill climate pollution.
California’s Annual Trash Footprint

California’s yearly trash is 45 times as heavy as the Golden Gate Bridge.
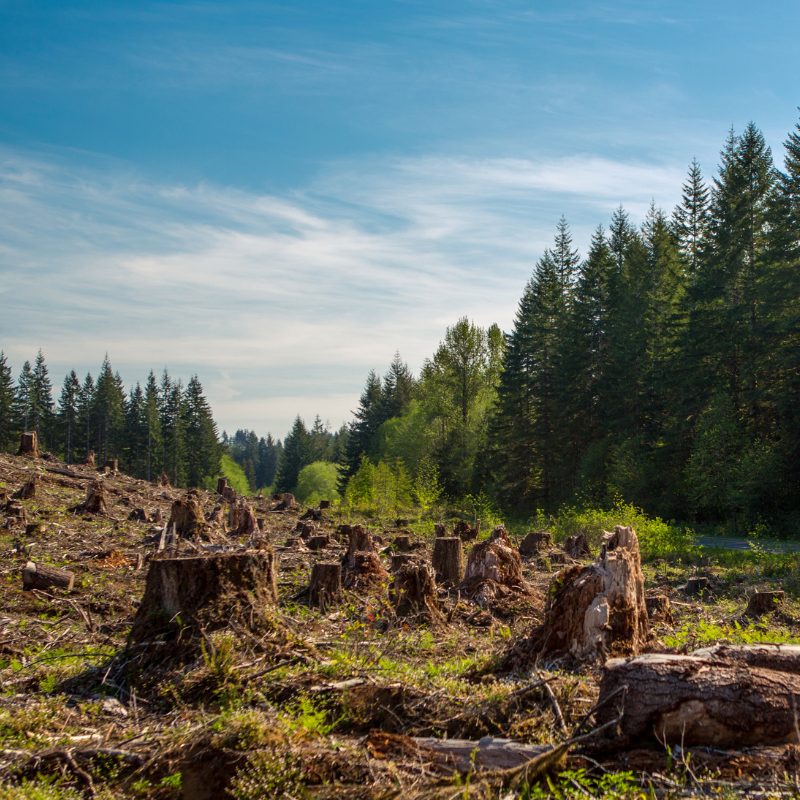
2.45 million trees worth of white office paper is used.
That’s 42,255 trees for every county.

7.27 billion meals worth of food waste goes to landfills a year.
What Is My Trash Footprint?
These statistics represent how much trash we throw away at home and contribute to in every sector of the economy.
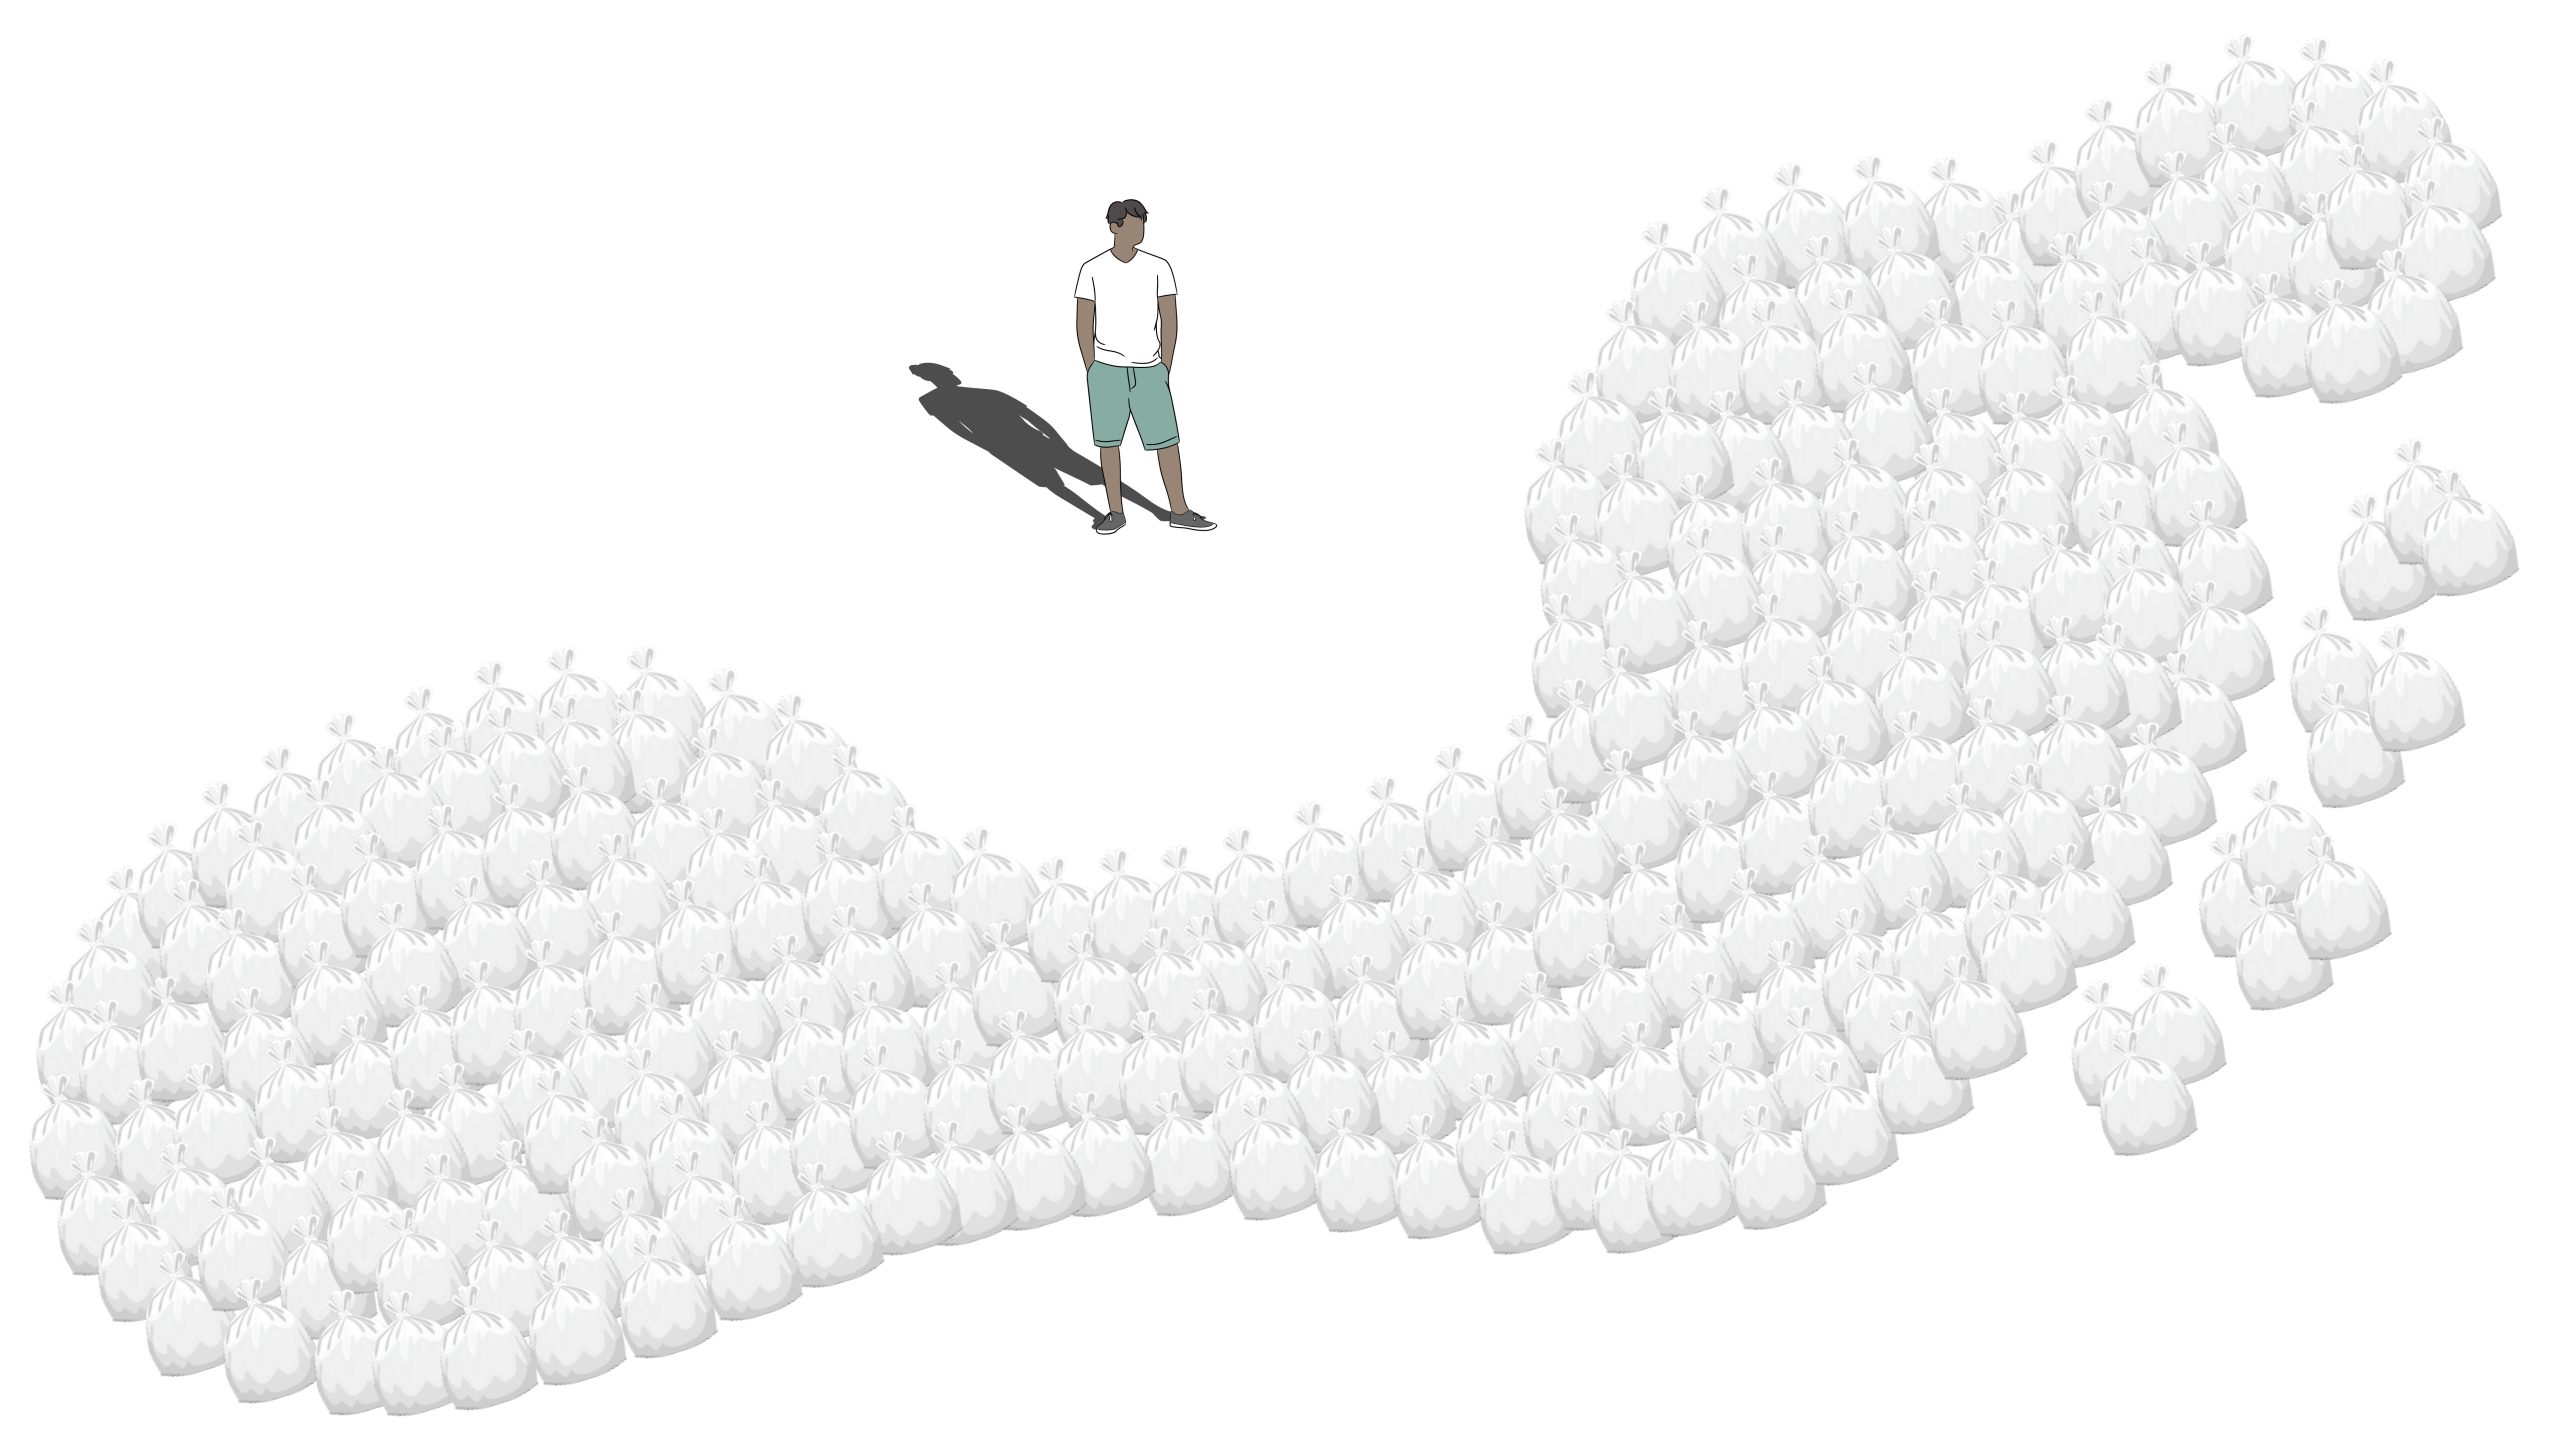
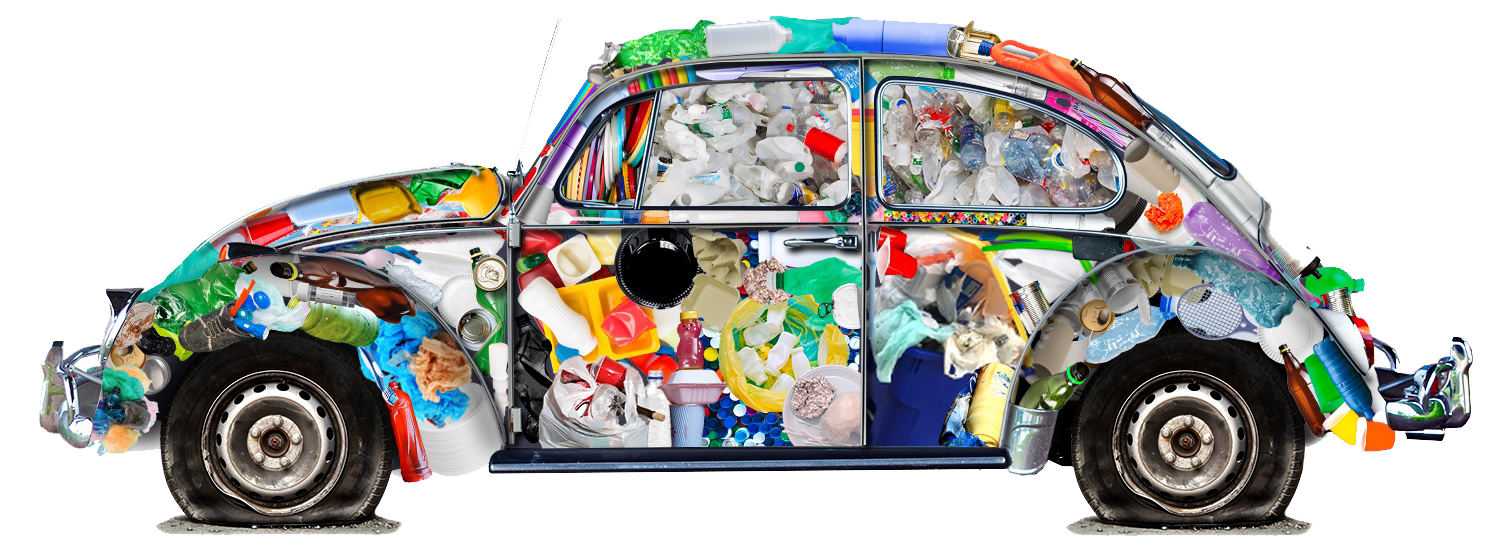
Californians throw away about 2,000 pounds of trash a year!
That equals to =
272 kitchen trash bags
The weight of a VW bug
Let’s break that down…
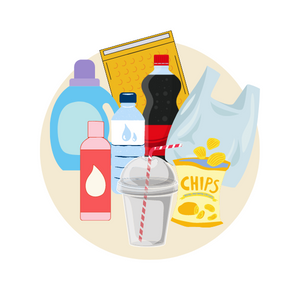
277 Pounds of Plastic
Equal to 4,200 Plastic Water Bottles
136 Bags of Packaging
185 Meals per Person
or
28 Days of Food
or
$1,500 Worth of Food per Family of Four

84 Pounds of Cardboard
Equal to 91 12x12x12 inch Boxes
315 Pounds of Paper
Equal to 63 Reams
California’s Waste Stream in Detail
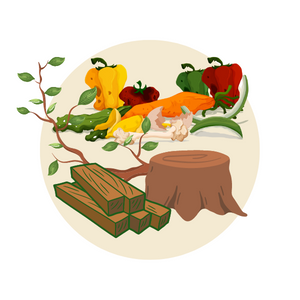
Organics
~29%
11.3 Million Tons
(Not all SB 1383 organic material types included.)
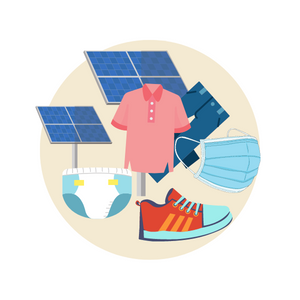
Miscellaneous
~17%
6.7 Million Tons
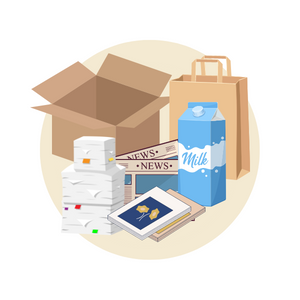
Paper
~15%
6.2 Million Tons
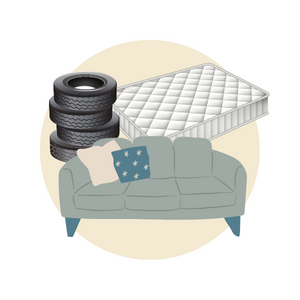
Special Waste
~5%
2 Million Tons
Plastic
~14%
5.4 Million Tons
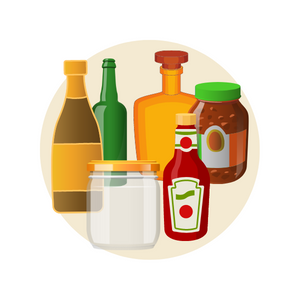
Glass
~2%
1 Million Tons
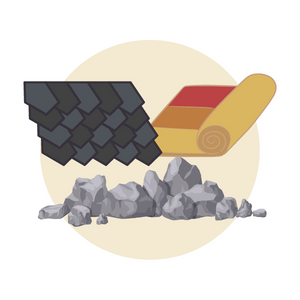
Inerts and Other
~12%
4.8 Million Tons

Electronics
~1%
344,267 Tons
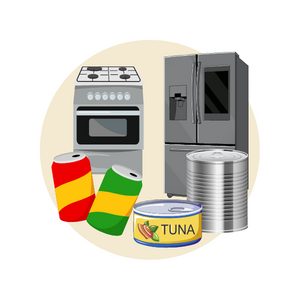
Metal
~5%
2 Million Tons

Household Hazardous Waste
>1%
121,346 Tons
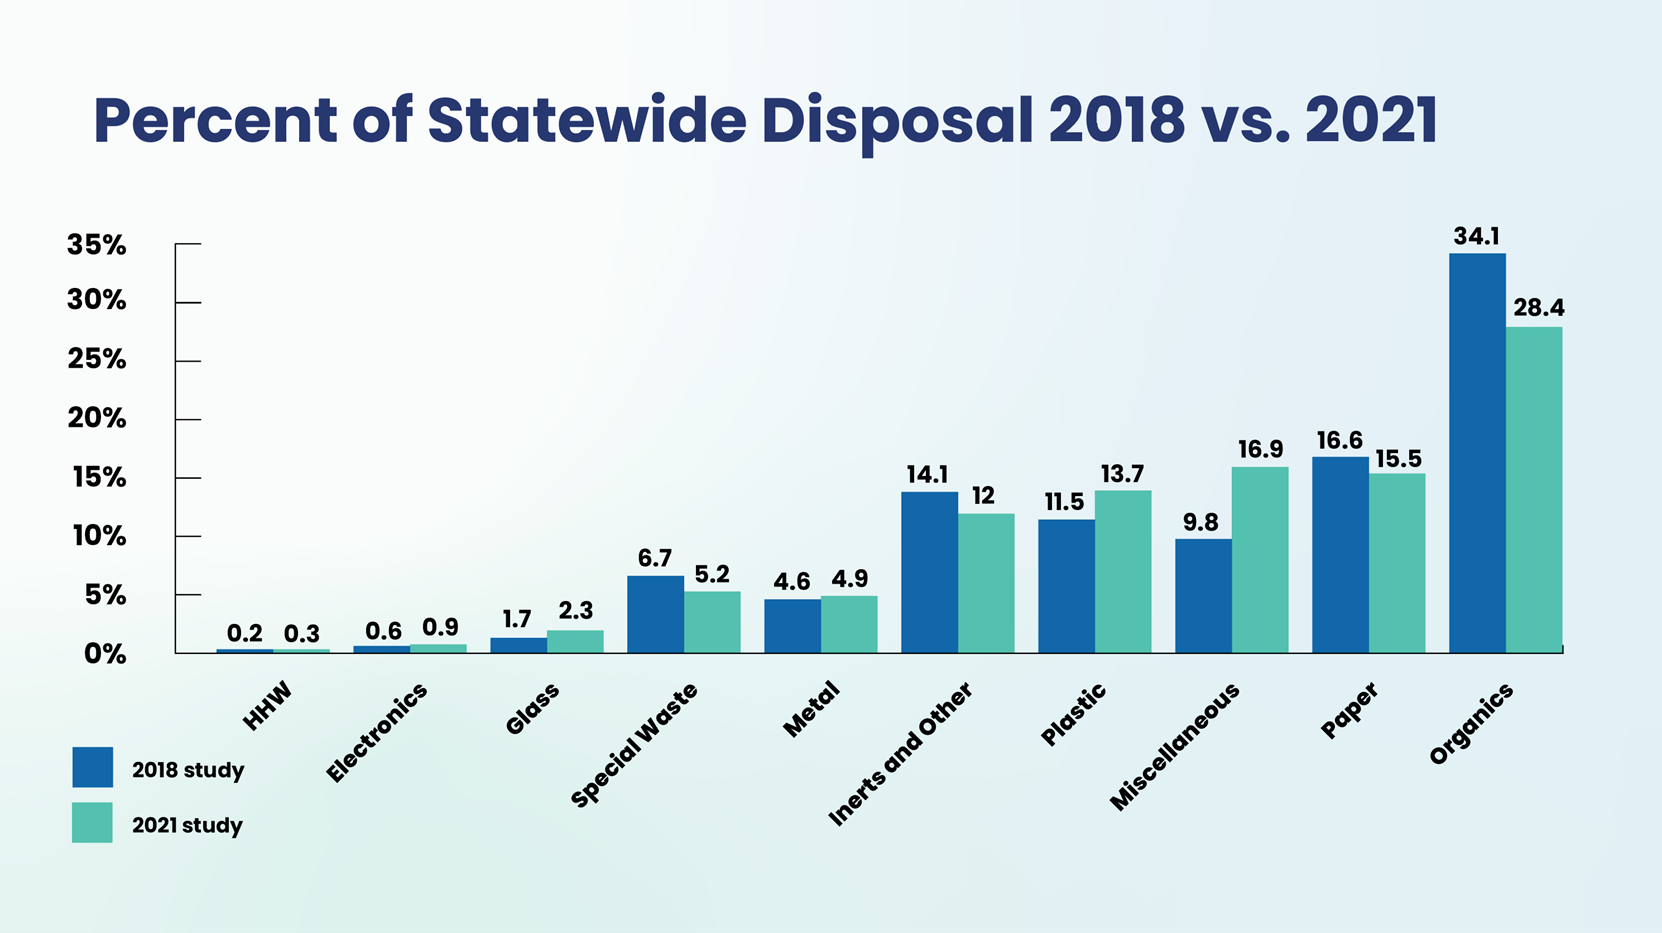
- Household Hazard Waste. 2018 rate: 0.2 percent. 2021 rate 0.3 percent
- Electronics. 2018 rate: 0.6 percent. 2021 rate 0.9 percent
- Glass. 2018 rate: 1.7 percent. 2021 rate 2.3 percent
- Special Waste. 2018 rate: 6.7 percent. 2021 rate 5.2 percent
- Metal. 2018 rate: 4.6 percent. 2021 rate 4.9 percent
- Inserts and Other. 2018 rate: 14.1 percent. 2021 rate 12 percent
- Plastic. 2018 rate: 11.5 percent. 2021 rate 13.7 percent
- Miscellaneous. 2018 rate: 9.8 percent. 2021 rate 16.9 percent
- Paper. 2018 rate: 16.6 percent. 2021 rate 15.5 percent
- Organics. 2018 rate: 34.1 percent. 2021 rate 28.4 percent
Key Takeaways
- Overall disposal has remained constant since 2018
- Packaging represents 27% of waste stream by weight
- Plastic represents 14% of waste stream by weight
- Organic waste disposal has decreased since 2014
California Recycling Programs Are Based on Scientific Research
Background
To fight trash and climate pollution, CalRecycle conducts scientific trash studies to understand better what we throw away and what could be recycled. This information provides the foundation for new legislation, policy decisions, and programs targeted at reducing what we bury in landfills.
In 2021, CalRecycle conducted a landfill study to analyze how much residents and businesses throw away. This study also investigated different categories of food waste and packaging.
These studies provide detailed information about the types of materials we throw away and how our trash changes over time as new products are introduced to the economy. We also gain insights into how trash varies from homes to various businesses and how much recyclable material is not yet collected for recycling.
In 2021, CalRecycle conducted a disposal facility-based study at a landfill and sorted the material into 88 categories from 4 sources.
Single-Family Homes Collected by Curbside Haulers

Commercial Businesses and Multi-Family Dwellings Collected by Curbside Haulers
Residents and Businesses that Self-Haul Material to Landfills
Material Consolidated at Transfer Stations and Sent to Landfills
For more information contact, the Office of Public Affairs, OPA@calrecycle.ca.gov