
Calendar Year 2022
Every year, CalRecycle measures California’s progress on our statewide goal to recycle 75% of all the waste we produce.
The department calculates how much waste California:
- Generates
- Sends to landfills
- Recycles and
- Exports to other countries for recycling.
Together, this data provides California’s recycling rate for all waste materials and insight into the state’s recycling infrastructure.
California is building a circular economy that can recycle all waste by:
- Reducing how much trash we make
- Creating responsible recycling markets.
This data highlights California’s improvements over the years and ongoing barriers to a circular economy. For example, seaborne exports of recyclable scrap to other nations has continued to decline, but is still the path for almost 15% of California’s recyclable materials.
Key Takeaways
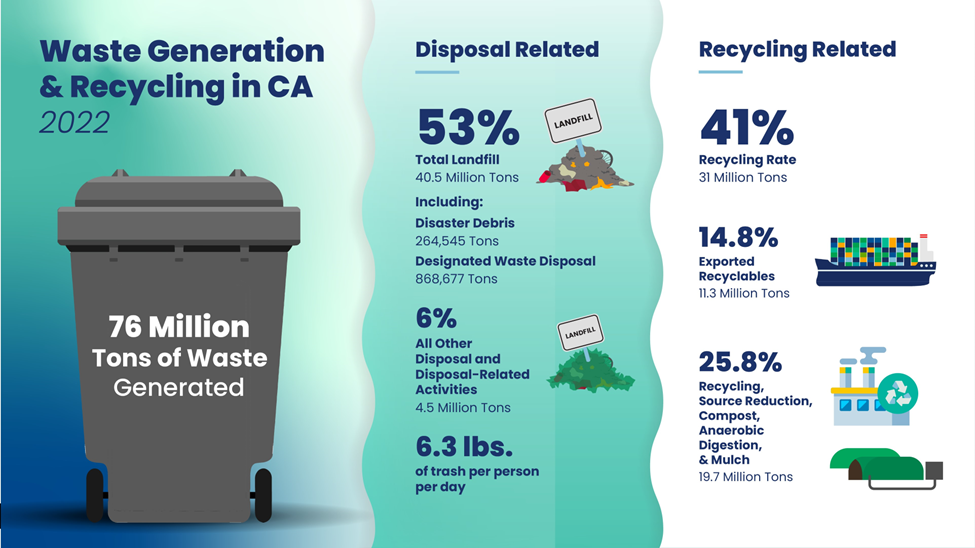
Waste Generation & Recycling in CA 2022
76 Million Tons of Waste Generated
Disposal Related
53% Total Landfill 40.5 Million Tons Including: Disaster Debris 264,545 Tons Designated Waste Disposal 868,677 Tons 6% All Other Disposal and Disposal-Related Activities 4.5 Million Tons 6.3 lbs. of trash per person per day
Recycling Related
41% Recycling Rate 31 Million Tons 14.8% Exported Recyclables 11.3 Million Tons 25.8% Recycling, Source Reduction, Compost, Anaerobic Digestion, Mulch 19.7 Million Tons
Exports
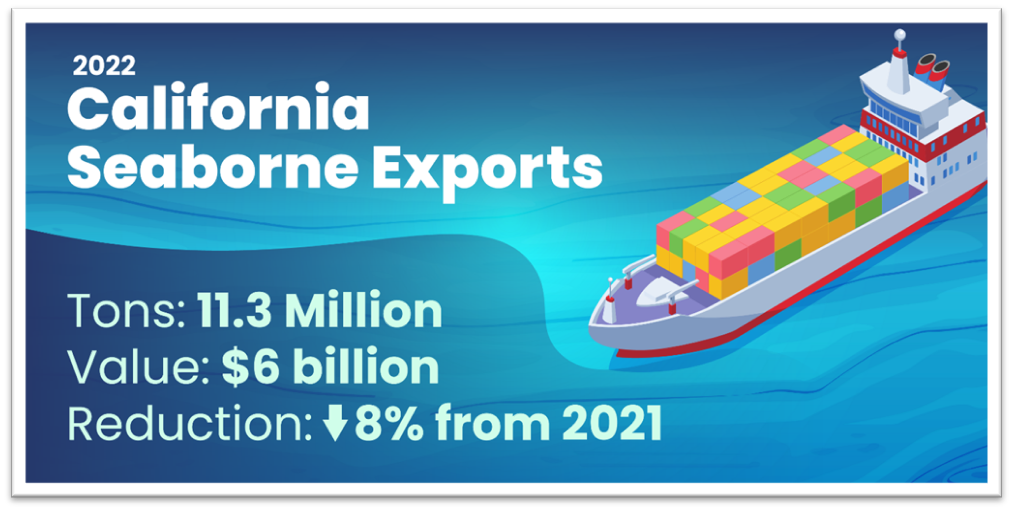
In 2022, California exported 11.3 million tons of recyclable materials to foreign countries. Unfortunately, exporting recyclable materials to other countries does not always result in the exported materials being recycled and can also result in negative environmental, economic, and social impacts, especially if the material is contaminated or sent to a place without adequate controls or infrastructure. In some cases, contaminated recyclables are landfilled or dumped into rivers that float into the ocean and migrate into the Pacific Garbage Patch off the coast of California.
Historically, California jurisdictions have received landfill diversion credit when exporting recyclable materials to other countries. With the passage of AB 881 (Lorena Gonzalez, Chapter 501, Statutes of 2021), jurisdictions will no longer receive diversion credit when exporting mixed plastic recyclables. CalRecycle will begin collecting information on the jurisdiction of origin for exports of mixed plastic through the Recycling and Disposal Reporting System (RDRS). This will help ensure that only plastic material exported responsibly will count as diversion from landfills and will open the door to more remanufacturing of recycled materials right here in our state.
International policies influence where our materials are sent. As countries adopt new policies and restrictions, the movement of California’s recyclable materials may shift.
Top Countries Importing Recyclable Materials from California in 2022
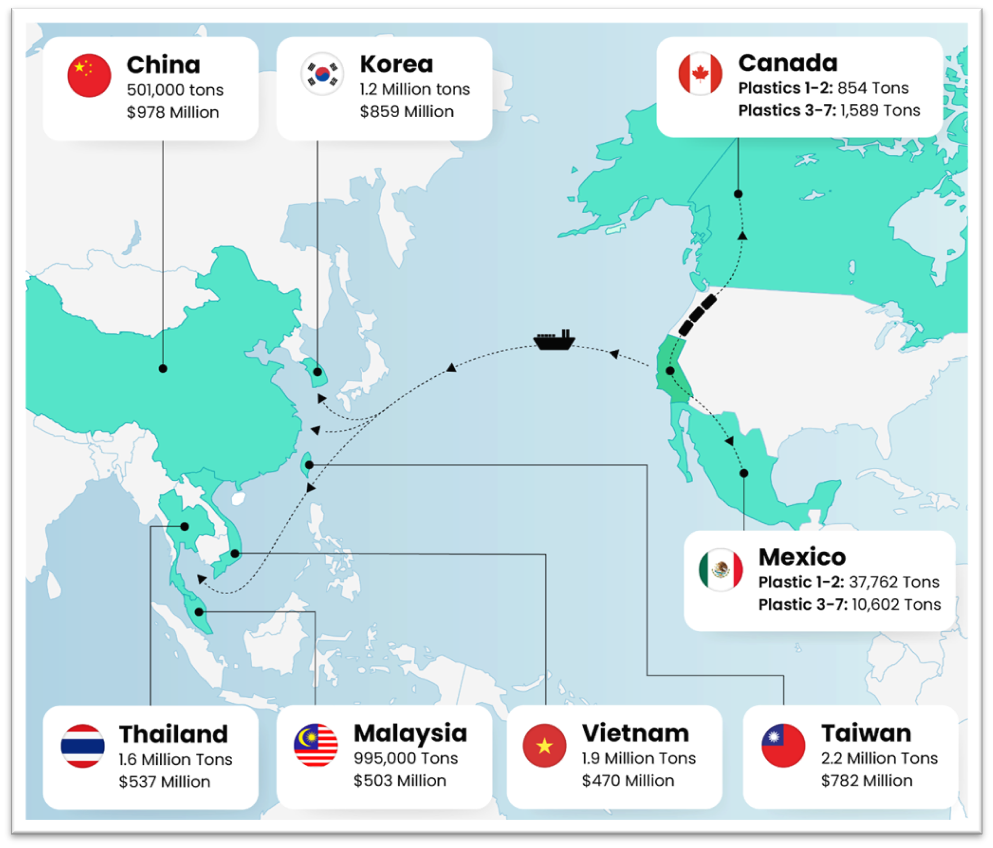
- China 501,000 tons $978 Million
- Korea 1.2 Million tons $859 Million
- Thailand 1.6 Million Tons $537 Million
- Malaysia 995,000 Tons $503 Million
- Mexico Plastic 1-2: 37,762 Tons Plastic 3-7:10,602 Tons
- Canada Plastics 1-2:854 Tons Plastics 3-7: 1,589 Tons
- Vietnam 1.9 Million Tons $470 Million
- Taiwan 2.2 Million Tons $782 Million
Exports of recyclable materials to China have been decreasing since 2012, largely as a result of China’s Green Fence and National Sword policies. In 2022, China fell to the eighth largest importer of recyclable materials from California. In contrast to the more than 13 million tons of recyclable material imported by China in 2011, China imported less than a million tons in 2022.
Starting in 2021, we estimated plastic exports to Canada and Mexico transported via truck and rail.
Changes in Seaborne Exports of Recyclable Materials between 2021 and 2022
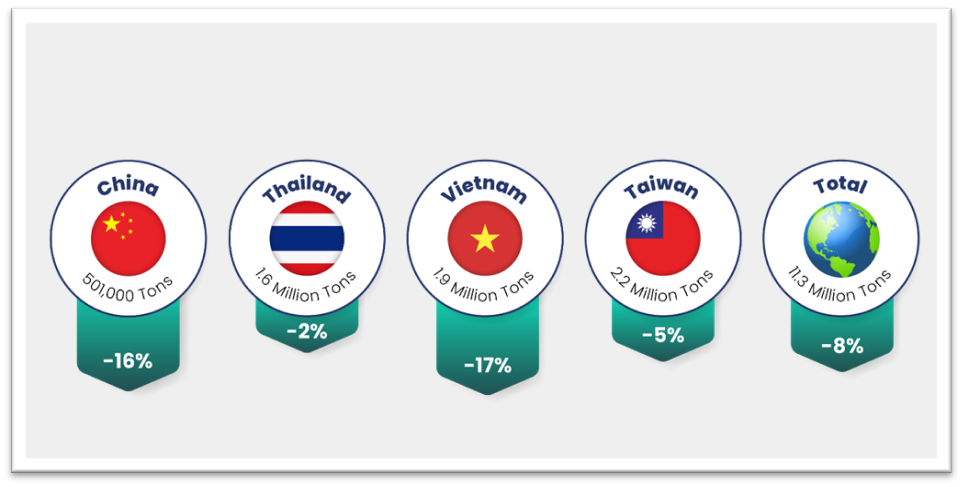
- China 501,000 tons -16%
- Thailand 1.6 million tons -2%
- Vietnam 1.9 million tons -17%
- Taiwan 2.2 million tons -5%
- Total 11.3 million tons -8%
Types of Materials Exported
California exports many types of scrap materials to other countries ranging from corrugated cardboard to metals to clothing.
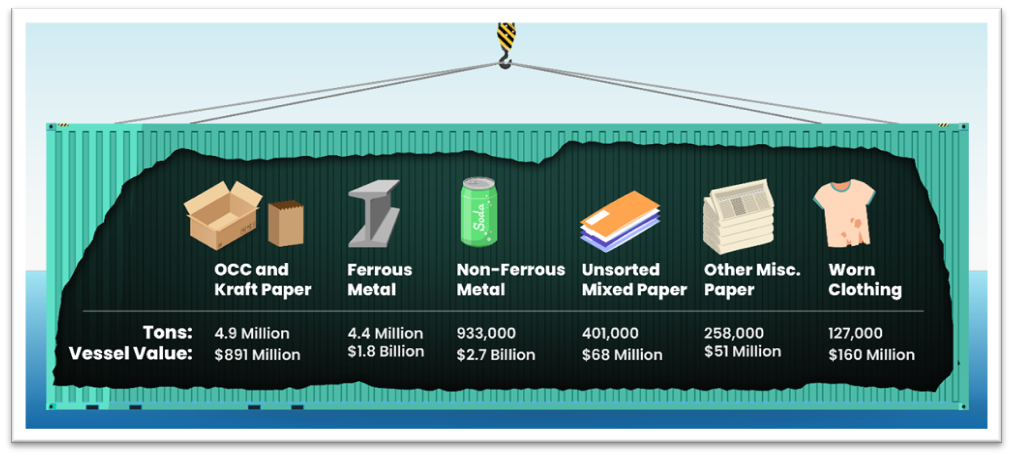
- OCC and Kraft Paper 4.9 million tons $891 million vessel value
- Ferrous Metal 4.4 million tons $1.8 billion vessel value
- Non-Ferrous Metal 933,000 tons $2.7 billion vessel value
- Unsorted Mixed Paper 401,000 tons $68 Million vessel value
- Other Mise. Paper 258,000 tons $51 Million vessel value
- Worn Clothing 127,000 tons $160 Million vessel value
The issue of contamination and import restrictions are especially important for plastics and plastic contamination, causing significant decreases in the amount of plastic scrap exported by California. In 2022, California exported less than 50 thousand tons of plastic scrap, compared to almost 1.3 million tons in 2014.
In order to achieve a circular economy, we must address the issue of contamination and get more remanufacturing of recycled materials right here in our state. CalRecycle is working with partners to ensure that products California produces and uses can be efficiently collected and remanufactured into new products here in our state.

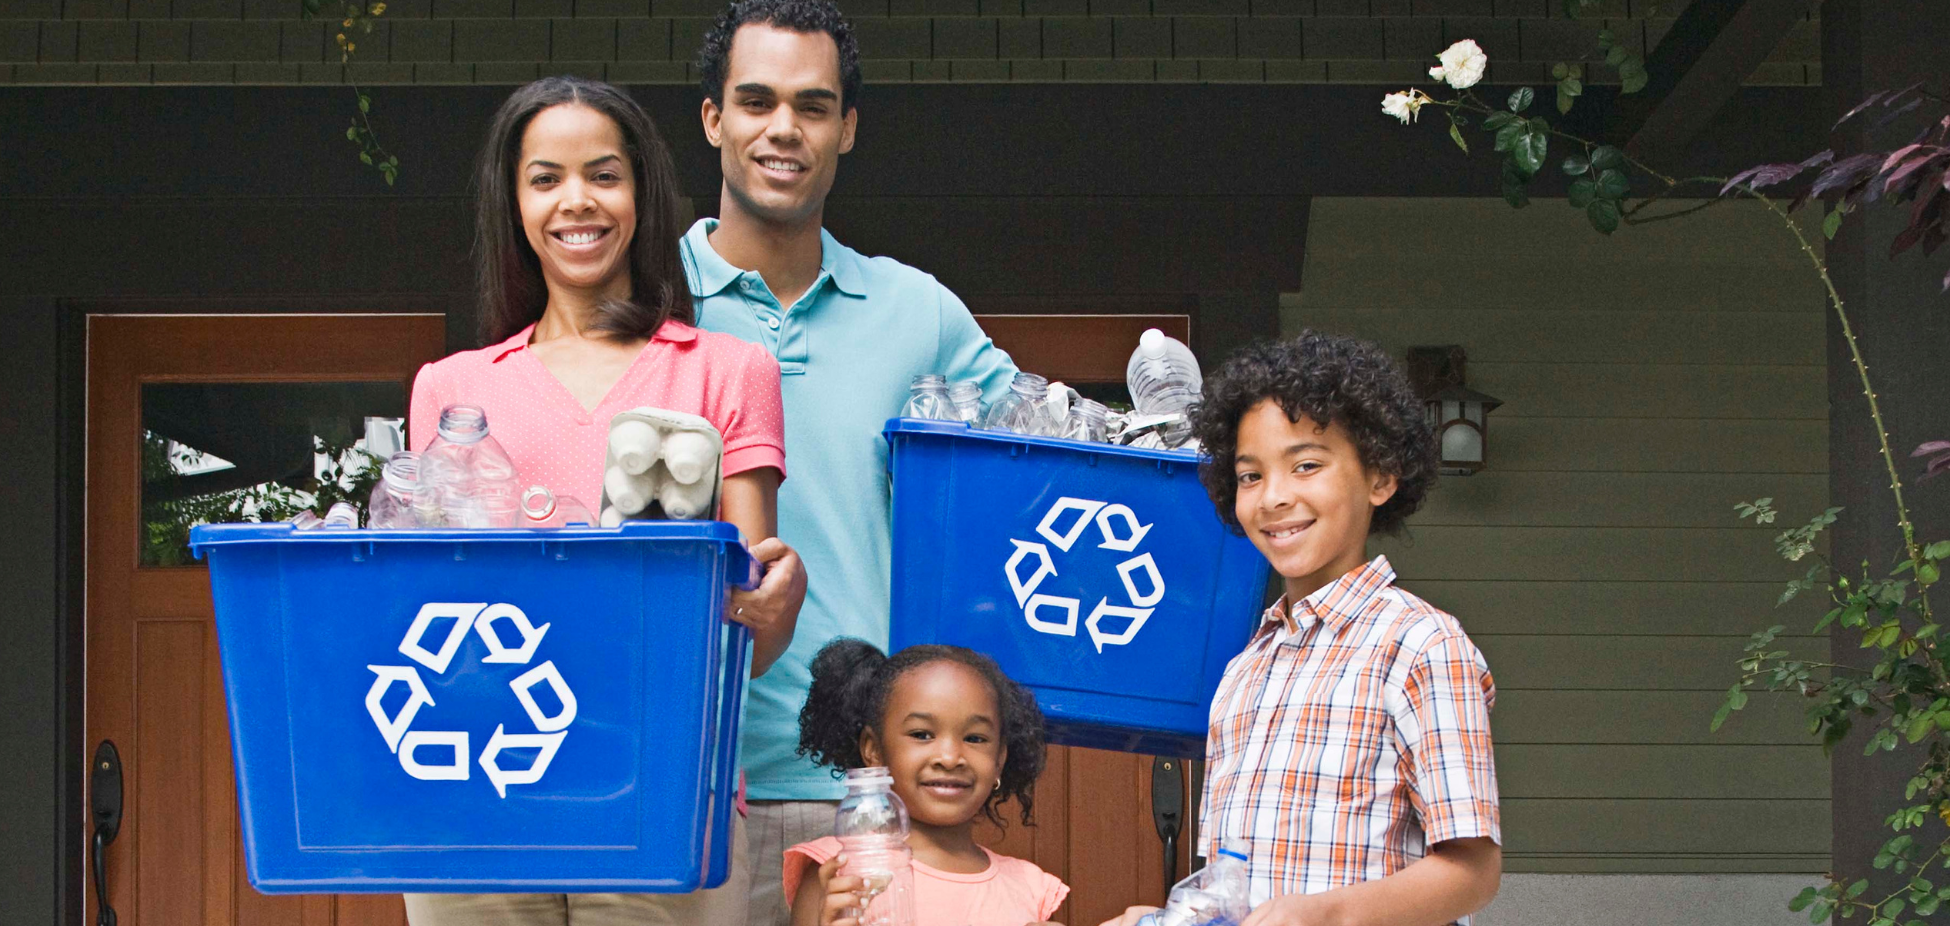
Do your part. Recycle smart.
California continues to strive towards its ambitious environmental goals. To learn more about how you can reduce recycling contamination, visit irecyclesmart.com.
For more information contact, the Office of Public Affairs, opa@calrecycle.ca.gov